Visual Understanding
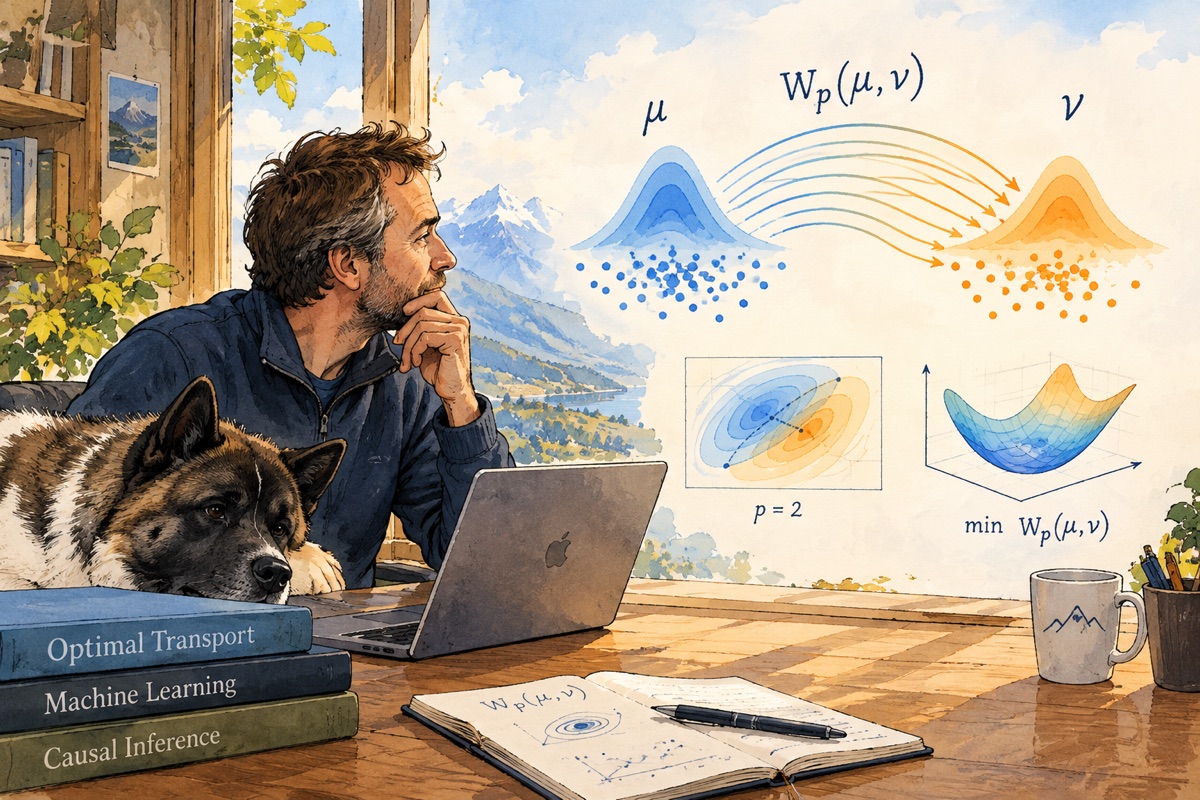
I am a visual guy. My understanding often rests on a visual representation. I therefore greatly appreciate 3Blue1Brown and other graphical or animated representations of concepts. I recently came across the work of Basem Rajjoub and decided to try to produce my own animations with Claude Opus 5.5. After some trial and error, I settled on HTML and JavaScript: the animations are fluid, they run in any browser, and the mathematics renders neatly.
I have produced a few animations for my students. Here are my favourites.
Ridge regression
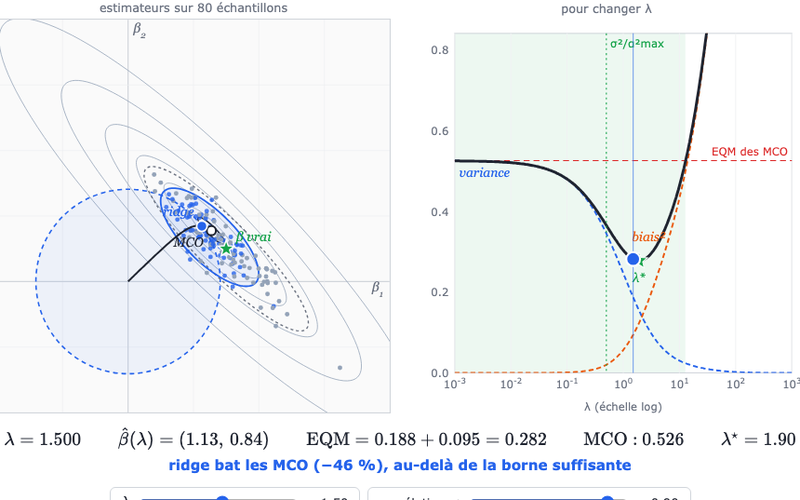
Bias against variance. Move λ and watch Hoerl and Kennard’s existence theorem at work: there is always a small amount of shrinkage that beats least squares. Try it.
k-means step by step
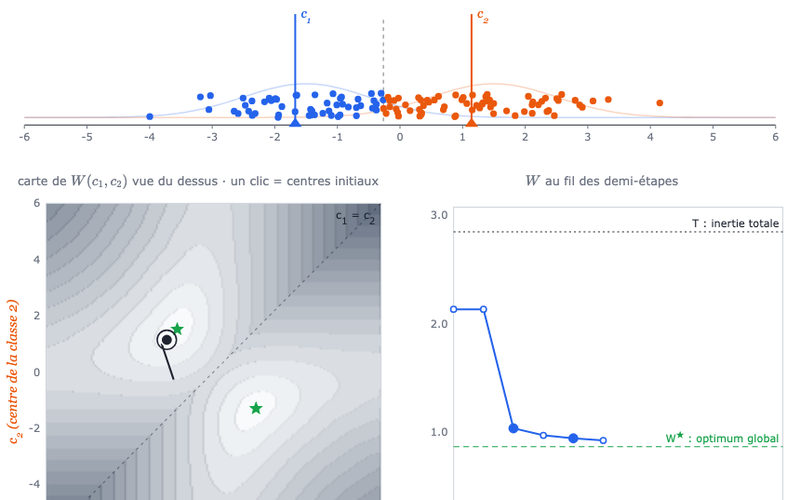
Two Gaussians on a line and Lloyd’s algorithm. Each iteration is also a step on the map of the criterion W(c₁, c₂), so you can see why the algorithm converges, and why it sometimes gets stuck. Try it.
Buffon’s needle
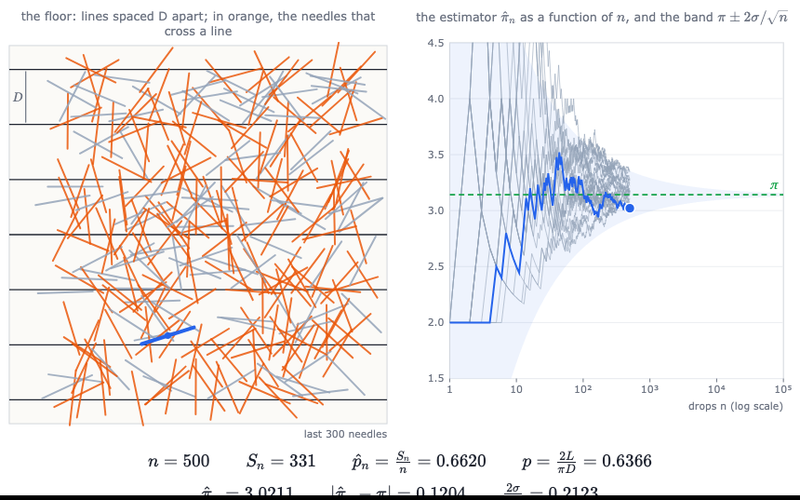
Estimating π by dropping needles on a floor. The noodle argument gives p = 2L/(πD); the law of large numbers does the rest, slowly, at rate 1/√n. Try it.
Simpson’s paradox
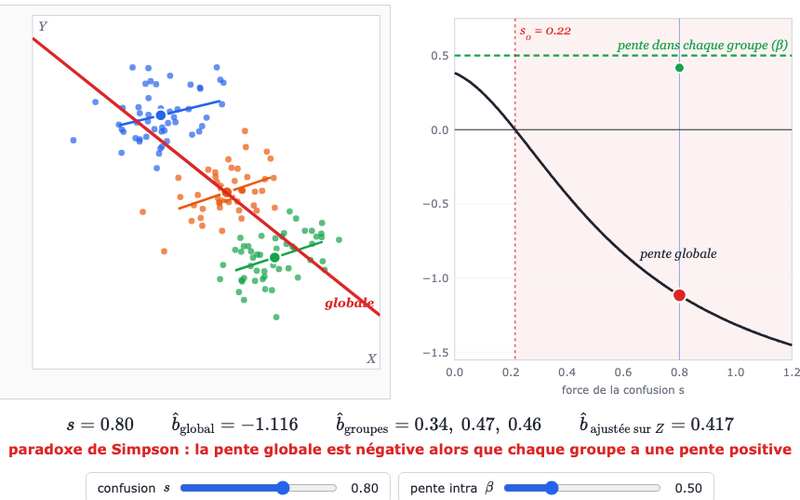
Make the confounder stronger and stronger: within each group the slope stays positive, yet the overall slope turns negative. Seeing the reversal happen continuously is more convincing than any table of numbers. Try it.
Enjoy all the other animations